

The literature search was performed from January 22nd2023 to March 28th2023 and retrieved 3701 records (3585 from databases and 116 from complementary searches). All 3701 records retrieved were stored using Mendeley Reference Manager, after removing duplicates, two researchers (CTS and RTA) proceeded verifying title/abstract and when needed the study was fully read, 38 studies were excluded as they were not fully retrieved, finally 168 studies were retrieved for eligibility. Among which, 30 studies were included in the qualitative synthesis. Figure 1 provides an overview of the selection process (PRISMA Flow Diagram). Characteristics of included studies are described in Figs. 2, 3 and 4. The list of all excluded studies and reason for exclusion described in Tables 16 and 17 in supplement.

PRISMA 2020 flow diagram selection process of included searches from databases and other sources
To verify the inter and intra-examiner’s reliability, 10% of the publications were randomly chosen. They were compared to obtain intra and inter-examiner Cohen Kappa’s coefficient, assessed through the IBM-SPSS Statistics (version 27). Tables 18 and 19 on supplemental materials show more details of each step verified and results. Values of Kappa above 0.9 are considered as an almost perfect level of agreement and have 82–100% of reliable data [26].
A total of 30 randomised controlled trials were analysed with a total number of 3486 healthcare students. It is not possible to know exactly how many female students were and how many were male students as three studies did not mention this data [27,28,29]. All included studies were conducted with healthcare students from four different degree types (three with pharmacy students [30,31,32], thirteen with medical students [27,28,29, 33,34,35,36,37,38,39,40,41,42], thirteen with nursing students [43,44,45,46,47,48,49,50,51,52,53,54] and nursing/midwifery [55]. There was no randomised controlled trial with dentistry students.
The studies were conducted in fifteen different countries, eleven studies came from Asia (four from China [42, 52, 53, 56], two from Turkey [43, 47], one from Thailand [36], one from India [37], two from Iran [49, 51] and one from Malaysia [57] ), ten studies from North America (nine from the USA [29,30,31, 35, 38, 39, 41, 44, 50] and one from Canada [28]), seven studies from Europe (two from Spain [45, 46], two from France [33, 34], one from Germany [27], one in Italy [48] and one in the United Kingdom [54]), one study from Australia/Oceania (New Zealand) [40] and one study from Africa(Ghana) [55]. Study publication dates ranged from 1987 to 2023, eighteen studies were published in the last five years [32, 33, 37, 39, 42,43,44,45,46,47,48,49, 51,52,53,54,55,56].
Studies sample size ranged from 21 to 362 participating students, fourteen studies had more than 100 participants [27, 28, 32,33,34,35, 42, 43, 46, 48, 52,53,54,55], thirteen studies had between 50 and 100 participants [29, 35, 36, 38, 40, 41, 44, 45, 47, 49,50,51, 56] and only three studies had less than 50 participants [30, 31, 39].
Studies were conducted with healthcare students through different types of interventions such as: communications/empathy skills training [27,28,29, 37, 38, 44, 46, 49, 55]; mindfulness training [41, 43]; narrative/literature intervention [30, 33, 53, 56]; simulation intervention [32, 35, 45, 50, 52]; role play technique [31, 36, 51]; transformative learning theory [47]; patient-experience training [48]; video or digital intervention [39, 52]; empathy intervention/innovation [40, 42] and Balint groups [30, 31].
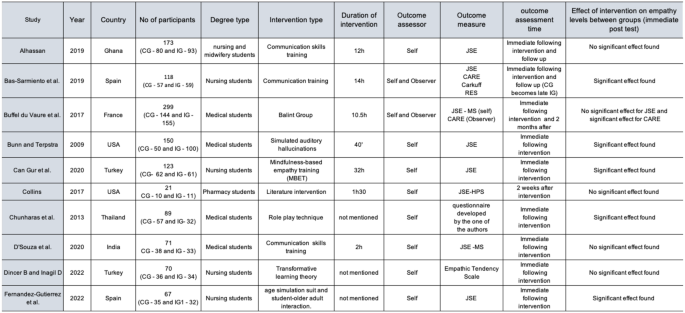
Characteristics of all included studies
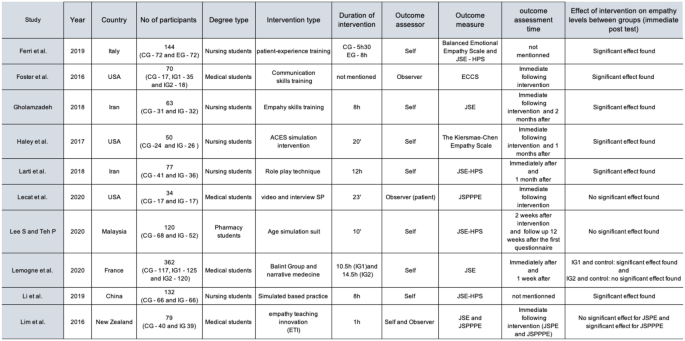
Characteristics of all included studies. Source: The authors
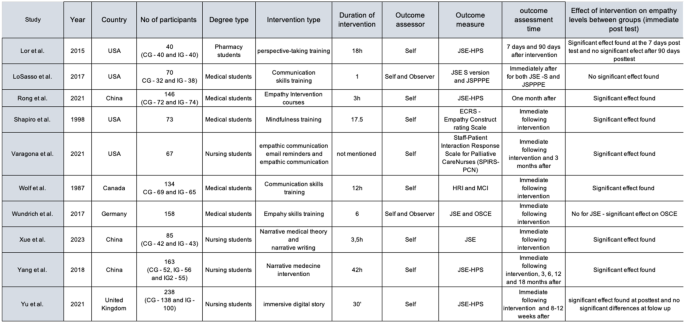
Characteristics of all included studies. Source: The authors
The Cochrane risk-of-bias tool for randomized trials (RoB2) was used to assess the risk of bias [17]. The RoB2 evaluates five domains related to possible study biases (randomisation process, deviation from the intended intervention, missing outcome data, measurement of the outcome and selection of the reported results).
Each study was evaluated for each of these domains and scored as low, some concerns or high risk of bias and evidence from the study was used to justify each score given. The overall risk of bias can be found at Fig. 5.

Overall Risk of bias assessment the RoB2 tool
Studies were considered at low risk of bias if all domains were judged as been at low risk, some concerns if a few domains are judged as some concern and high risk of bias if at least one outcome domain was judged at high risk or multiple domains judged to be of some concern [17]. Among 30 studies, eighteen were considered high risk of bias [24,25,26, 28, 32, 33, 38, 40, 42,43,44,45,46, 48, 50, 52], eleven were considered with some concerns [27, 31, 34,35,36,37, 39, 47, 49, 51, 53] and one was considered as low risk of bias [29]. See supplement Tables 20, 21, 22, 23, 24, 25, 26, 27, 28, 29, 30, 31, 32, 33, 34, 35, 36, 37, 38, 39, 40, 41, 42, 43, 44, 45, 46, 47, 48 and 49 for Risk of Bias of all included studies and support for judgement.
Meta-analysis results
Of the 30 studies included in this systematic review, 10 studies were excluded from the meta-analysis. Seven of them were excluded after the primary analysis, as they did not provide adequate data (Mean and SD) from which to calculate the Standardized mean difference (SMD). Two of those studies provided only percentage data [33, 36], two studies provided only median information [39, 44] and three studies did not provide any data [24, 38, 41]. Missing or unclear data for the meta-analysis was requested by email directly to all corresponding authors. Only two authors [33, 41] returned our emails and could not provide the requested data.
The other 3 studies [30, 35, 50] were excluded since they had two intervention groups and one control group, considering that an inclusion criteria for the meta-analysis was only studies with one intervention and one control group. At the end 20 studies were included in the meta-analysis.
The primary analysis presents the results of the meta-analysis for all included studies concerning healthcare students (Fig. 6). The figure shows: the forest plot, the statistical measures of the studies (mean, standard deviation and n for intervention and control groups), study weight, standard mean difference, the respective 95% confidence interval, as well as the results of the test Cochran’s Q, the value of the I2 statistics. One study [37] was not included in this overall meta-analysis as it provided only observer assessor data (through JSPPPE) and all the other studies were self-assessor (through JSE). One study [43] was included separately as centre 1 and centre 2 as the data provided by the authors already separated both centres.
Analysing the results presented (Fig. 6), regarding the 95% confidence interval associated with the difference in means, the studies: Alhassan, 2019; Bas-Sarmiento et al., 2019; Bunn and Terpstra, 2009; Collins et al., 2017; D’Souza et al., 2020; Lee and Teh, 2020 and LoSasso et al., 2017 contain the value zero, so it can be inferred that the differences between the experimental group and the control group are not statistically significant. On the other hand, it is observed that the studies: Bas-Sarmiento et al., 2019 (center2); Lee and Teh, 2020 and Wolf et al., 1987, present a treatment effect that favours the control group, because they are to the left of the vertical line, whilst the other studies favours the experimental group.
The forest plot shows a total of 1122 participants on the intervention group and 1037 participants on the control group and an overall moderate effect on participants empathy postintervention favouring the experimental group (SMD 0.45, 95% CI 0.25 to 0.65). This influence is statistically significant which is further confirmed by the statistic Z = 4.43 with p < 0.001.
As for heterogeneity, Cochran’s Q (p < 0.001) and I2 = 79% are observed, suggesting a high heterogeneity.

Meta-analysis results for all healthcare students
Sensitivity analysis
Due to the high heterogeneity (I2 = 79%), it was decided to explore this heterogeneity by conducting a sensitivity analysis. The sensitivity analyses were managed by assessing the risk of bias of each study. The studies that were judged as high risk of bias were excluded from this new forest plot (Fig. 7).

Meta-analysis results for all healthcare students without high-risk of bias studies
The new forest plot (Fig. 7) shows a total of 484 participants on the intervention group and 489 participants on the control group and an overall moderate effect on participants empathy postintervention favoring the experimental group (SMD 0.45, 95% CI 0.20 to 0.70). This influence is statistically significant which is further confirmed by the statistic Z = 3.52 with p < 0.001 and I2 = 69% remained considerable, although the intensity decreased.
Participant population subgroup analysis
The overall Effect (Fig. 8) on participants empathy postintervention favours the experimental group (standardized mean difference 0.45, 95% CI 0.25 to 0.65). This influence is statistically significant. However, due to the high heterogeneity (I2 = 79%), It was decided to explore de heterogeneity by conducting a subgroup meta-analysis31 and try to examine potential sources of heterogeneity in our overall meta-analysis, and, if possible, to identify where heterogeneity came from. First, analysing the results of test for subgroup differences, it shows that the subgroups appear to have different effects (p = 0.05).

Meta-analysis subgroup results participant population
The subgroup medical students shows a total of 391 participants on the intervention group and 333 participants on the control group and a not statistically significant effect on participants empathy postintervention (SMD 0.11, 95% CI -0.25 to 0.46), I2 = 80%, suggesting a high heterogeneity between studies.
The subgroup pharmacy students shows a total of 83 participants on the intervention group and 98 participants on the control group and a not statistically significant effect on participants empathy postintervention (SMD 0.30, 95% CI -0.25 to 0.84), I2 = 60%, suggesting a moderate heterogeneity between studies from this subgroup.
The subgroup nursing students shows a total of 648 participants on the intervention group and 606 participants on the control group and moderate effect on participants empathy postintervention favouring the experimental group (SMD 0.63, 95% CI 0.39 to 0.87), I2 = 76%, suggesting a high heterogeneity between studies from this subgroup.
The medical students and the nursing students subgroups have a high heterogeneity (respectively 80% and 76%) and the pharmacy students subgroup a moderate heterogeneity (60%), which can imply that the heterogeneity might not only depend on the degree being analysed (because subgroups have different effects) but also another aspect within those subgroups, mainly for medical and nursing students.
This heterogeneity can be due to clinical or methodological differences and different kinds of interventions used by these studies, but to be sure we would have to make new subgroups from each subgroup.
Outcome assessor analysis – self-assessed
Figure 6 shows a total of 1001 participants on the intervention group and 944 participants on the control group and an overall moderate effect on participants empathy postintervention favouring the experimental group (SMD 0.45, 95% CI 0.29 to 0.60). This influence is statistically significant which is further confirmed by the statistic with p < 0.001.
As for heterogeneity, Cochran’s Q (p < 0.001) and I2 = 69% are observed, suggesting a moderate heterogeneity.
When analysing the results of test for subgroup differences, it shows that the subgroups appears to have similar effects (p = 0.14), Fig. 9.

Meta-analysis Subgroup results self-assessed
The subgroup JSE-S version shows a total of 326 participants on the intervention group and 264 participants on the control group and a statistically significant effect on participants empathy postintervention (SMD 0.31, 95% CI 0.14 to 0.47), I2 = 0%, suggesting a low heterogeneity between studies.
The JSE-HPS version shows a total of 675 participants on the intervention group and 680 participants on the control group and a statistically significant effect on participants empathy postintervention (SMD 0.50, 95% CI -0.30 to 0.71), I2 = 69%, suggesting a substantial heterogeneity between studies from this subgroup.
We can conclude that the heterogeneity is not due to the kind of instrument (JSE-S version or HPS-version) but to another source within the studies of the JSE-HPS subgroup.
Outcome assessor analysis – Observer-assessed.
Figure 10 shows a total of 291 participants on the intervention group and 273 participants on the control group and a not statistically significant effect on participants empathy postintervention favouring the control group (SMD 0.29, 95% CI -0.050 to 0.63), p = 0.10. As for heterogeneity, Cochran’s Q (p < 0.001) and I2 = 69% are observed, suggesting a moderate heterogeneity [30]. Analysing the results of test for subgroup differences, it shows there is evidence that the effect is different in the subgroups (p = 0.02), meaning that there are differences between the CARE and the JSPPPE.
The CARE subgroup presents a statistically significant effect on participants empathy postintervention favouring the experimental group, while the JSPPPE presents a non-statistically.
significant effect on participants empathy postintervention favouring the control group.
Also, when looking the heterogeneity, only the CARE subgroup has a substantial heterogeneity (I2 = 66%) which suggests there is an aspect causing the heterogeneity which does not depend on the studies of the JSPPPE subgroup.

Meta-analysis Subgroup results observer-assessed
The certainty of evidence was performed using GRADE pro, (Fig. 11), the quality of evidence is very low due to serious risk of bias (twelve studies included were considered high risk and seven had uncertainty risk of bias) and very serious inconsistency (high heterogeneity between studies − 79%).

link